 |
Characteristics of sound signal
|
 |
 |
 | 1 | 2 | 3 | 4 | | 1 | 2 | 3 | 4 | 
|
What is the sound, right?
Sound is a form of energy that manifests as a fluctuation of pressure in the medium it travels through. The most widespread medium that human uses is air, but the sound is spread through water, brick, glass, wood, and everything has a density. The lower the temperature below the speed of sound. The higher the density of air (or any media) provides higher speed of sound. Typically, the sound is associated with propagation through the air and the speed of propagation in normal conditions is about 340 m/s The light is spread far more quickly, approximately 300'000'000 m/s. Therefore, it is easy to calculate how far away a storm is 'burst' if eve flashes because 'thunder always comes after lightning'. The only place where the sound can not exist is in a vacuum or the environment at a temperature of absolute zero (-273°C). So, all of those science fiction movies with photon torpedoes and dazzling explosions (no oxygen) with a tremendous noise, are pure fiction, it can not happen in the universe. The absence of media prevents propagation of sound. The biggest stunt was affected when the spaceship 'fall' :-).
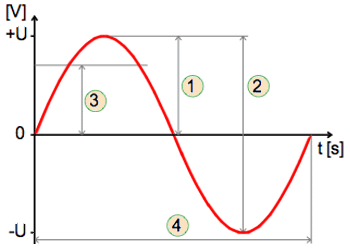
Sound is a series of waves of ever changing compression and rarefaction of molecules media. Compression occurs when the sound source makes the surrounding air molecules together and thus increases the air pressure, and dilution occurs when the molecules of air expands to fill a larger space and cause a drop in air pressure. Four measurable parameters describing sound: amplitude, frequency, wavelength and phase. Amplitude describes the magnitude of change in the air pressure. The amplitude can be measured as shown in Figure 2.1.
 |

|
|
Figure 2.1 Amplitudes of the signal.
|
|
By labels in Figure 2.1 apply to the following notion of amplitude:
- 1. Peak Amplitude.
- 2. Peak-to-Peak Amplitude.
- 3. Power Amplitude - effective value (RMS - Root Means Squared Amplitude).
Under the amplitude of power entails the notion that it was an electrical sinusoidal signal of constant amplitude that an amplifier can play for about 15 minutes without emerging signal degradation and for that amount usually says it is NOMINAL or RATED POWER (RMS power).
With the concept of signal is closely related the term 'frequency'.
- 4. Number of completed cycles of the waveform in one second. Measure of frequency is Hertz (Hz). Audible range of hearing for humans is between 20 Hz and 20'000 Hz. Frequencies below the specified range are called subsonic, and those above the specified range are called ultrasonic.
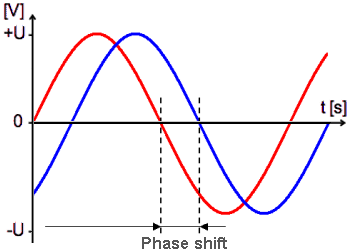
Description of sinusoidal signal is covered under Chapter 1.3. Phases within the audio content describes the relationship between two or more sinusoidal waveforms that form the final waveform audio content. In Figure 2.2 shows the possible phase between two sinusoidal signals of the same amplitude. Analogous to the description in Chapter 1.3, figure that follows is described as what are doing two mutually spaced vectors over time.
 |

|
|
Figure 2.2 Phase shift between signals.
|
|
In the graph at Figure 2.2 red curve is used as a reference, and the blue curve in relation to it lags by 90°. That is to say, the displayed signal vectors rotate at the same speed, but they are mutually spaced by 90°. If using sources that are waveforms of the same amplitude and frequency, and the phase difference is 0°, the result will be the same waveform with twice the amplitude. If sources are the wave of the same amplitude and frequency but 180° phase difference, the result will be a amplitude of size zero, or silence. Any other phase relationship will result in modifying the phase of the waveform that is between these two phases. Almost all sounds, except sine waves are complex waveforms contain more signals of different amplitudes and frequencies.
Most sounds consist of signals that describe the following four groups of frequencies:
- Fundamental (basic) - Signal of lowest frequency in the audio signal. According to the fundamental understanding of the music determines the 'height' (pitch) of sound.
- Harmonics - Signals of smaller amplitude and higher frequency than the basic signal, where the frequency is an integer multiple of the fundamental frequency. They are basically with much less amplitude if the frequency of basic signal is greater.
- Overtones - Signals that the frequencies above the fundamental frequency, but which are not multiples of the fundamental frequency and are not harmonics.
- Formants - Signals caused by physical, like resonant, features of source that the amplitude and frequency of broadcasting is not changing. For example, it emits a sound from source because of its natural resonant properties. So formants do not change when you change the properties of the basic waveforms.
The theory deals with sound waves and their way through the air or through a material. In this sense propagation of acoustic waves is considered in several categories:
- Absorbtion - Removing the sound energy in the medium through which the sound wave travels or converting sound wave energy into other forms of energy: heat, kinetic energy, electricity or some other form. Sound will lose portions of their energy, as they are absorbed.
- Refraction - Sound waves change their speed and direction when passing through media with different densities and temperatures. If the difference in the density of the media is greater, the greater is the change in direction of propagation. Denser material conducts sound faster. Higher temperatures also allow faster implementation of sound through it.
- Diffraction - Bending or bypassing the sound around physical objects. Degree to bypass depends on the relative size of the object and the wavelength of the wave. Generally, the higher the sound wave wavelength easier to circumnavigate the obstacle. If the sound wave is a complex form of low-frequency components will bend around obstacles better than high frequency components.
- Reflection - The situation when the original sound wave collision with a smooth surface and bounces at an angle equal to the angle of arrival of the wave source, but on the opposite side. The corners are particularly problematic, as there may be multiple reflections and the reflected wave 'returns' in the same direction as the original, which can lead to their mutual contest.
- Diffusion - Irregular surfaces may result in diffusion and dispersion sound wave in various directions. Typically occurs when a sound wave encounters overfire on that has fissure through which the spraying.
Due to above, in the untreated room can expect a number of problems concerning its acceptable acoustics. Very different ways and materials to make a room acoustically friendly. Not the same design for the home theater room and the right theater. Besides the theater entirely full of visitors has better acoustic characteristics in relation to the half empty theater. The human is a good acoustic absorber.
There are two ways of understanding the propagation of sound waves:
- Acoustics of ray - Describes how sound waves of high frequency response when interacting with objects and media of different densities. High frequency wave behaves as a successive step in the sequence of complex billiard balls.
- Acoustics of wave - Describes how sound waves of low frequency response when interacting with objects and media of different densities. Low frequency wave behaves like waves in the water.
Sound has features like it has a light or X-rays, and has measurable parameters. According to Figure 2.1 are connected by the following equation (wave equation):
The above equation allows to calculate the several of critical data relating to the room where the home theater and the perception of the listener.
- Let the speed of propagation of sound c=340 m/s. The room in which the home theater has dimensions of 7 m × 5 m × 3 m (L×W×H), and the distance between opposing walls and the ceiling and the floor. When there is a reflection of the wave on the wall opposite the source, stripped off wave adds or subtracts from the original, depending on whether they are mutually in phase or antiphase. If they are under the overall amplitude increases, and if they are in antiphase result of a drastic decline in overall amplitude. Thus, it is possible constructive and destructive reflections. When a sound wave reflection changes the phase and direction. Interference of two waves of equal amplitude moving opposite each other spell the resonant formation process, which is called a standing wave. At the appropriate wavelengths occur nodes (zero amplitude) and bellies (doubled amplitude). This means that these room dimensions correspond to the resonant frequencies of 24 Hz, 34 Hz and 56 Hz, according to the equation f=C/(2×dimension). Sound waves of these frequencies will strongly intensify and stress in relation to the other, and the waves are smaller and higher frequencies will be suppressed, leading to nonlinearity of the sound image. Higher frequency harmonic components do not have such a negative impact due to their much smaller amplitude. As for this, the wall paneling and the original wave absorption should give due consideration to rejecting an acoustic wave which had a smaller amplitude. The above shows that the trapezoidal space acoustically advantageous than conventional rectangular space or completely round. The small area of the same size, for example, when the distance between the walls and the height of 2.80 m, there will be an enormous amount of blur tones of low frequency around 60 Hz. In such a space to use expensive sound system makes no sense.
- Let the average distance between the ears of the head of 20-30 cm. This means that the sound wave is coming to the ears of the time (phase) difference. If the time difference is greater than 1 ms positions auditory experience depends on the sound wave which first came to the ears. Delayed sound wave to the other ear, becomes irrelevant in terms of localization. How the ear registers the difference in the sound pressure, and no matter where the source of the sound eye because it allows distinguishing sound pressure at the front and back of the head. People with bigger and lop ears will have a more efficient localization. At very low frequencies, below 100 Hz, the phase difference is negligible. Then the pressure on the left and right ear nearly in phase. Therefore, at such low frequencies is not getting enough information to determine the direction of arrival of the sound, and a man in this area practically no ability to localize the direction from which the sound. Therefore, for the reproduction of low frequencies, only one speaker (subwoofer) who normally plays in the frequency range of 20-200 Hz and has a fairly large membrane, sometimes over 30 cm, as shown in Figure 3.1b. Furthermore, it shall have a considerable power, as is clear from the isometric curve shown in Figure 1.2a.
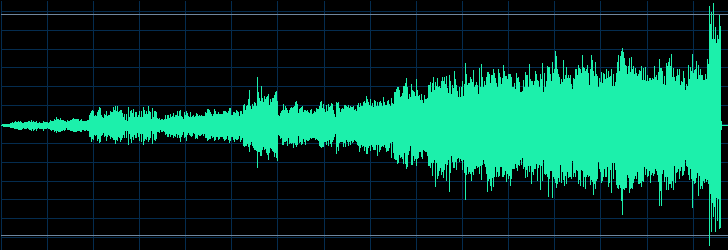
That music is a set of sound waves of different amplitudes and frequencies, it is clear that their sum total does not care about proper form, as shown in Figure 2.1, but the waveform looked to the example on the next set of pictures.

|
|
Figure*** 2.3 Signal of music file - Ravel: Bolero, The New York Philharmonic.
( + / - )
|
From the example shows that the dynamic range of a considerable amplitude, and that not come even close a continuous signal of the same amplitude and frequency, but it's a wealth of colorful signals. The dynamic range is:
- Minimum RMS power: -143.18 dB
- Maximum RMS power: -8.66 dB
- Average RMS power: -25.67 dB
- Total RMS power: -23.77
The stated values refer to the reference value: 0 dB = FS Square Wave. So it is a measure for the digital recording and the image can be read 2.4d each sampling point, based on the RMS range above it is clear that this is a 24-bit sampling (sample depth), the sampling frequency of 44.1 kHz (sampling rate), the degree of compression mp3 320 kbps (bit rate). The average RMS value indicates that the amplifier does not have to play a huge RMS continuous power, but that must allow as much dynamic range.
So let's assume that the playback amplifier uses declared (nominal) power of 200 W, which can develop on the consumer (resistor) than 4 Ω or 8 Ω. Supply voltage output transistor amplifier is ±62 V, which gives the maximum amplitude of 60 V to the position ' 1 ' in Figure 2.1, the RMS value of the voltage of 42 V (RMS) to position ' 3 ' in Figure 2.1, and the range between the two peaks amplitude of 120 V to the position ' 2 ' in Figure 2.1. This last measure would be happy to show most manufacturers of second-rate equipment, but no notes on where the amplitude does. According to Ohm's law (P=U 2 /R) RMS power of the consumer is a 440 W at resistor of 4 Ω, with above 200 W RMS refers to the power load on the criteria for a period of 15 minutes with a constant signal amplitude and frequency of 1 kHz, with no increase of distortion. Power signal amplitude by these parameters is 900 W. The range between the two amplitudes gives another striking value - 3600 W, a soul given to boasting about selling second-rate equipment.
By construction and characteristics that are primarily related to the signal distortion, power amplifiers can be classified into several categories.
- Class A - The active elements of amplifiers operate in push-pull mode and handle the entire period of continuous signals, or no alternating switching on and off of the output components, very low distortion, high heat dissipation, efficiency is up to 50%. Due to the very small distortion preamplifier active elements operate exclusively in the class ' A '.
- Class B - Operate in push-pull mode. Signals are processed one active element for a half-period of signal, and the second for the another half-period of signal, and alternately active elements switchs on and off. Nonlinearity is present in the area of reproduction of small signals, i.e. higher distortion compared to the class ' A '; less heat dissipation, efficiency is about 75%.
- Class AB - Operate in push-pull mode. The combination of Class ' A ' and ' B '; in the manner that the output of an active element of a half-period of signal, have a small part of the signal processing in the other half-period signal, and thus compensate for the distortion in the small signal, less distortion as compared to the class ' B ', and slightly larger dissipation; efficiency between 50% and 75%.
- Class C - Output active elements amplify only the peaks of signal at the half-period, is not used in audio technology; have already in the high frequency technique.
- Class D - So called 'digital' amplifier. Active elements work in to a switched mode at a frequency of about 200 kHz. Pulse-width modulation effect on the total power and the resulting signal is passed through a low frequency filter to the consumer; greater distortion, very high efficiency, theoretically 100%. With the SPS power supply, amplifier has very small dimensions. Ideal for mobile devices.
- Class E/F - Amplifiers operate similar class ' D ', but they excite the LC resonant circuit, is not used in audio technology, but in the high frequency technique exists.
- Class G - The combination of two differently configured ' AB ' class with two supply voltage levels. Realized higher dynamics and greater linearity for small signals, increased efficiency compared with ' AB ' class.
- Class H - Automatically changes the supply voltage according to the size of the signal, although the operating mode of active elements is identical to the class ' AB ', increased efficiency compared with ' AB ' class.
- Class S - Amplifier of class ' A ' low power empowers the consumer through an amplifier of class ' C ', not used in audio technology but in the high frequency technique.
So, when buying the audio system, the default is that the preamplifier working class ' A '. A huge amplification with strong negative feedback connections distortion of power amplifier in class ' AB ' are almost negligible. What we should take into account is that the larger the available dynamic range of the power amplifier. The distortion should be less than 0.05%, and the dynamics of about 90 dB. Regarding the achievement of greater dynamics must take account of its own amplifier noise. For high quality playback noise level should be at least 20 dB lower than the quietest music signals. Taking into account all of the above is satisfactory power amplifiers for home use is about 150 W per channel.
 | 1 | 2 | 3 | 4 | | 1 | 2 | 3 | 4 | 
|
Citing of this page:
Radic, Drago. " Informatics Alphabet " Split-Croatia.
{Date of access}; https://informatics.buzdo.com/specific/file.
Copyright © by Drago Radic. All rights reserved. | Disclaimer
|


